
10.2. Deflategate#
On January 18, 2015, the Indianapolis Colts and the New England Patriots played the American Football Conference (AFC) championship game to determine which of those teams would play in the Super Bowl. After the game, there were allegations that the Patriots’ footballs had not been inflated as much as the regulations required; they were softer. This could be an advantage, as softer balls might be easier to catch.
For several weeks, the world of American football was consumed by accusations, denials, theories, and suspicions: the press labeled the topic Deflategate, after the Watergate political scandal of the 1970’s. The National Football League (NFL) commissioned an independent analysis. In this example, we will perform our own analysis of the data.
Pressure is often measured in pounds per square inch (psi). NFL rules stipulate that game balls must be inflated to have pressures in the range 12.5 psi and 13.5 psi. Each team plays with 12 balls. Teams have the responsibility of maintaining the pressure in their own footballs, but game officials inspect the balls. Before the start of the AFC game, all the Patriots’ balls were at about 12.5 psi. Most of the Colts’ balls were at about 13.0 psi. However, these pre-game data were not recorded.
During the second quarter, the Colts intercepted a Patriots ball. On the sidelines, they measured the pressure of the ball and determined that it was below the 12.5 psi threshold. Promptly, they informed officials.
At half-time, all the game balls were collected for inspection. Two officials, Clete Blakeman and Dyrol Prioleau, measured the pressure in each of the balls.
Here are the data. Each row corresponds to one football. Pressure is measured in psi. The Patriots ball that had been intercepted by the Colts was not inspected at half-time. Nor were most of the Colts’ balls – the officials simply ran out of time and had to relinquish the balls for the start of second half play.
This is an observational case, not a randomized experiment. The test below assesses a specified exchangeable-label model for the measured pressure drops. It cannot determine whether anyone deliberately changed a ball’s pressure. In management, the same distinction applies when comparing defects from two existing suppliers.
Run the demonstration cells in order. Each Interactive Exercise supplies its own data.
football = pd.read_csv(path_data + 'deflategate.csv')
football
| Team | Blakeman | Prioleau | |
|---|---|---|---|
| 0 | Patriots | 11.50 | 11.80 |
| 1 | Patriots | 10.85 | 11.20 |
| 2 | Patriots | 11.15 | 11.50 |
| 3 | Patriots | 10.70 | 11.00 |
| 4 | Patriots | 11.10 | 11.45 |
| 5 | Patriots | 11.60 | 11.95 |
| 6 | Patriots | 11.85 | 12.30 |
| 7 | Patriots | 11.10 | 11.55 |
| 8 | Patriots | 10.95 | 11.35 |
| 9 | Patriots | 10.50 | 10.90 |
| 10 | Patriots | 10.90 | 11.35 |
| 11 | Colts | 12.70 | 12.35 |
| 12 | Colts | 12.75 | 12.30 |
| 13 | Colts | 12.50 | 12.95 |
| 14 | Colts | 12.55 | 12.15 |
For each of the 15 balls that were inspected, the two officials got different results. It is not uncommon that repeated measurements on the same object yield different results, especially when the measurements are performed by different people. So we will assign to each the ball the average of the two measurements made on that ball.
football_1 = football.copy()
football_1['Combined'] = (football_1['Blakeman']+football_1['Prioleau'])/2
football_combined = football_1.drop(columns=['Blakeman','Prioleau'])
football_combined
| Team | Combined | |
|---|---|---|
| 0 | Patriots | 11.650 |
| 1 | Patriots | 11.025 |
| 2 | Patriots | 11.325 |
| 3 | Patriots | 10.850 |
| 4 | Patriots | 11.275 |
| 5 | Patriots | 11.775 |
| 6 | Patriots | 12.075 |
| 7 | Patriots | 11.325 |
| 8 | Patriots | 11.150 |
| 9 | Patriots | 10.700 |
| 10 | Patriots | 11.125 |
| 11 | Colts | 12.525 |
| 12 | Colts | 12.525 |
| 13 | Colts | 12.725 |
| 14 | Colts | 12.350 |
At a glance, it seems apparent that the Patriots’ footballs were at a lower pressure than the Colts’ balls. Because some deflation is normal during the course of a game, the independent analysts decided to calculate the drop in pressure from the start of the game. Recall that the Patriots’ balls had all started out at about 12.5 psi, and the Colts’ balls at about 13.0 psi. Therefore the drop in pressure for the Patriots’ balls was computed as 12.5 minus the pressure at half-time, and the drop in pressure for the Colts’ balls was 13.0 minus the pressure at half-time.
We can calculate the drop in pressure for each football, by first setting up an array of the starting values. For this we will need an array consisting of 11 values each of which is 12.5, and another consisting of four values each of which is all 13. We will use the NumPy function np.ones, which takes a count as its argument and returns an array of that many elements, each of which is 1.
np.ones(11)
array([1., 1., 1., 1., 1., 1., 1., 1., 1., 1., 1.])
patriots_start = 12.5 * np.ones(11)
colts_start = 13 * np.ones(4)
start = np.append(patriots_start, colts_start)
start
array([12.5, 12.5, 12.5, 12.5, 12.5, 12.5, 12.5, 12.5, 12.5, 12.5, 12.5,
       13. , 13. , 13. , 13. ])
The drop in pressure for each football is the difference between the starting pressure and the combined pressure measurement.
drop = start - football_combined['Combined']
football_combined['Pressure Drop'] = drop
football_combined
| Team | Combined | Pressure Drop | |
|---|---|---|---|
| 0 | Patriots | 11.650 | 0.850 |
| 1 | Patriots | 11.025 | 1.475 |
| 2 | Patriots | 11.325 | 1.175 |
| 3 | Patriots | 10.850 | 1.650 |
| 4 | Patriots | 11.275 | 1.225 |
| 5 | Patriots | 11.775 | 0.725 |
| 6 | Patriots | 12.075 | 0.425 |
| 7 | Patriots | 11.325 | 1.175 |
| 8 | Patriots | 11.150 | 1.350 |
| 9 | Patriots | 10.700 | 1.800 |
| 10 | Patriots | 11.125 | 1.375 |
| 11 | Colts | 12.525 | 0.475 |
| 12 | Colts | 12.525 | 0.475 |
| 13 | Colts | 12.725 | 0.275 |
| 14 | Colts | 12.350 | 0.650 |
It looks as though the Patriots’ drops were larger than the Colts’. Let’s look at the average drop in each of the two groups. We no longer need the combined scores.
football_combined1 = football_combined.copy()
football_combined_average = football_combined1.drop(columns=['Combined'])
football_combined_average = football_combined_average.groupby(by=['Team']).mean()   ### group the table by 'Team' and compute the mean of 'Pressure Drop' for each team

football_combined_average = football_combined_average.reset_index()                 ### reset the index of the table to make 'Team' a column again
football_combined_average = football_combined_average.rename(columns={'Pressure Drop':'Pressure Drop average'}) ### rename the column to 'Pressure Drop average'
football_combined_average
| Team | Pressure Drop average | |
|---|---|---|
| 0 | Colts | 0.468750 |
| 1 | Patriots | 1.202273 |
The average drop for the Patriots was about 1.2 psi compared to about 0.47 psi for the Colts.
The question now is why the Patriots’ footballs had a larger drop in pressure, on average, than the Colts footballs. Could it be due to chance?
10.2.1. The Hypotheses#
How does chance come in here? Nothing was being selected at random. But we can make a chance model by hypothesizing that the 11 Patriots’ drops look like a random sample of 11 out of all the 15 drops, with the Colts’ drops being the remaining four. That’s a completely specified chance model under which we can simulate data. So it’s the null hypothesis.
For the alternative, we can take the position that the Patriots’ drops are too large, on average, to resemble a random sample drawn from all the drops.
10.2.2. Test Statistic#
A natural statistic is the difference between the two average drops, which we will compute as “average drop for Patriots - average drop for Colts”. Large values of this statistic will favor the alternative hypothesis.
observed_means = football_combined_average['Pressure Drop average']
observed_difference = observed_means.iloc[1] - observed_means.iloc[0]
observed_difference
np.float64(0.733522727272728)
This positive difference reflects the fact that the average drop in pressure of the Patriots’ footballs was greater than that of the Colts.
The function difference_of_means takes three arguments:
the name of the table of data
the label of the column containing the numerical variable whose average is of interest
the label of the column containing the two group labels
It returns the difference between the mean drops of the two groups. We will calculate the difference as the Patriots’ drops minus the Colts’ drops as before.
def difference_of_means(table, label, group_label):
    """Return Patriots minus Colts, using names rather than sorted positions."""
    means = table.groupby(group_label)[label].mean()
    return means.loc['Patriots'] - means.loc['Colts']
difference_of_means(football_combined, 'Pressure Drop', 'Team')
np.float64(0.733522727272728)
This is the same as the value we found earlier as the observed_difference. Notice that the difference has been calculated as Patriots’ drops minus Colts’ drops as before.
10.2.3. Predicting the Statistic Under the Null Hypothesis#
If the null hypothesis were true, then it shouldn’t matter which footballs are labeled Patriots and which are labeled Colts. The distributions of the two sets of drops would be the same. We can simulate this by randomly shuffling the team labels.
The model treats the observed drops as exchangeable between teams. That assumption needs scrutiny because initial pressures were not recorded precisely and measurement conditions may differ. Averaging two gauges does not remove every possible systematic measurement error. A small p-value challenges this model; it does not rule out those alternative explanations.
np.random.seed(42)
original_and_shuffled = football_combined.copy()
original_and_shuffled['Shuffled Label'] = np.random.permutation(football_combined['Team'])
original_and_shuffled[['Team', 'Pressure Drop', 'Shuffled Label']]
| Team | Pressure Drop | Shuffled Label | |
|---|---|---|---|
| 0 | Patriots | 0.850 | Patriots |
| 1 | Patriots | 1.475 | Colts |
| 2 | Patriots | 1.175 | Patriots |
| 3 | Patriots | 1.650 | Colts |
| 4 | Patriots | 1.225 | Patriots |
| 5 | Patriots | 0.725 | Patriots |
| 6 | Patriots | 0.425 | Patriots |
| 7 | Patriots | 1.175 | Patriots |
| 8 | Patriots | 1.350 | Colts |
| 9 | Patriots | 1.800 | Patriots |
| 10 | Patriots | 1.375 | Patriots |
| 11 | Colts | 0.475 | Patriots |
| 12 | Colts | 0.475 | Colts |
| 13 | Colts | 0.275 | Patriots |
| 14 | Colts | 0.650 | Patriots |
How do all the group averages compare?
difference_of_means(original_and_shuffled, 'Pressure Drop', 'Shuffled Label')
np.float64(-0.3147727272727274)
difference_of_means(original_and_shuffled, 'Pressure Drop', 'Team')
np.float64(0.733522727272728)
The two teams’ average drop values are closer when the team labels are randomly assigned to the footballs than they were for the two groups actually used in the game.
10.2.4. Permutation Test#
It’s time for a step that is now familiar. We will repeatedly simulate of the test statistic under the null hypothesis by repeatedly permuting the footballs and assigning random sets to the two teams.
As usual, we will start by writing a function one_simulated_difference that returns one simulated value of the difference between the mean pressure drops of the groups labeled Patriots and Colts after randomly permuting the team labels of the footballs.
def one_simulated_difference(table, label, group_label):
    shuffled = table.copy()
    shuffled['Shuffled Label'] = np.random.permutation(table[group_label])
    return difference_of_means(shuffled, label, 'Shuffled Label')
We can now use a for loop and this function to create an array differences that contains 10,000 values of the test statistic simulated under the null hypothesis.
np.random.seed(42)
differences = np.array([])
repetitions = 10000
for _ in range(repetitions):
    differences = np.append(differences, one_simulated_difference(
        football_combined, 'Pressure Drop', 'Team'))
### Exercise: Use the Actual Number of Repetitions
# In this small practice simulation, larger differences favor the alternative.
# Compute the tail fraction using the number of results actually present.
# Do not divide by a planned repetition count stored elsewhere.
import numpy as np
observed = 0.7
simulated = np.array([0.1, 0.8, -0.2, 0.7, 0.3])
### Your code starts here.

### Your code ends here.
Tail fraction: 0.4
10.2.5. Conclusion of the Test#
To calculate the empirical P-value, it’s important to recall the alternative hypothesis, which is that the Patriots’ drops are too large to be the result of chance variation alone.
Larger drops for the Patriots favor the alternative hypothesis. So the p-value is the chance (computed under the null hypothesis) of getting a test statistic equal to our observed value of 0.733522727272728 or larger.
empirical_P = np.mean(differences >= observed_difference)
print('Simulated p-value:', empirical_P)
Simulated p-value: 0.0027
The figure below visualizes this calculation. It consists of the empirical distribution of the test statistic under the null hypothesis, with the observed statistic marked in red on the horizontal axis and the area corresponding to the p-value shaded in gold.
fig, ax = plt.subplots(figsize=(7, 4))
ax.hist(differences, bins=25, density=True, edgecolor='white')
ax.axvline(observed_difference, color='red', linestyle='--', label='Observed difference')
ax.axvspan(observed_difference, max(differences.max(), observed_difference) + 0.05,
           color='gold', alpha=0.4, label='At least as extreme: right tail')
ax.set_title('Prediction Under the Exchangeable-Label Null Model')
ax.set_xlabel('Mean Pressure Drop: Patriots Minus Colts (psi)')
ax.set_ylabel('Probability Density')
ax.legend()
<matplotlib.legend.Legend at 0x7f038b164440>
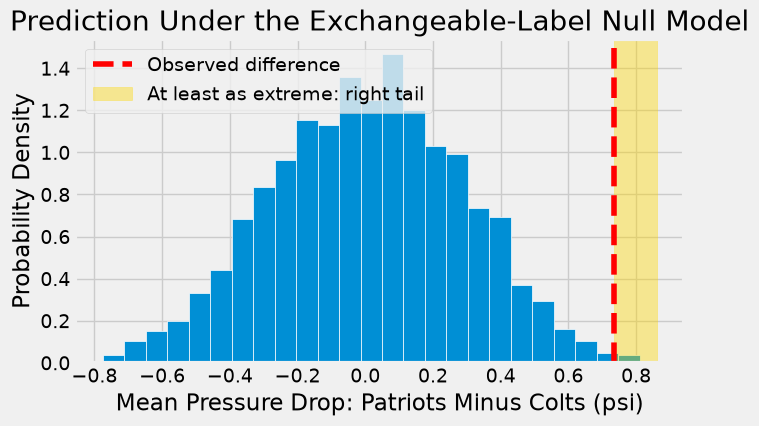
By eye, the p-value looks pretty small. We can confirm this by a calculation.
empirical_P = np.mean(differences >= observed_difference)
print('Simulated p-value:', empirical_P)
Simulated p-value: 0.0027
As in previous examples of this test, the bulk of the distribution is centered around 0. Under the null hypothesis, the Patriots’ drops are a random sample of all 15 drops, and therefore so are the Colts’. Therefore the two sets of drops should be about equal on average, and therefore their difference should be around 0.
But the observed value of the test statistic is quite far away from the heart of the distribution. At a significance level of 0.05 selected in advance, the simulated p-value leads us to reject the stated exchangeable-label null model. The observed difference is unusual under that model. This conclusion depends on the assumptions used to calculate and compare the pressure drops.
The independent investigative team analyzed the data in several different ways, taking into account the laws of physics. The final report said,
“[T]he average pressure drop of the Patriots game balls exceeded the average pressure drop of the Colts balls by 0.45 to 1.02 psi, depending on various possible assumptions regarding the gauges used, and assuming an initial pressure of 12.5 psi for the Patriots balls and 13.0 for the Colts balls.”
– Investigative report commissioned by the NFL regarding the AFC Championship game on January 18, 2015
Our analysis shows an average pressure drop of about 0.73 psi, which is close to the center of the interval “0.45 to 1.02 psi” and therefore consistent with the official analysis.
Remember that our test of hypotheses does not establish the reason why the difference is not due to chance. Establishing causality is usually more complex than running a test of hypotheses.
But the all-important question in the football world was about causation: the question was whether the excess drop of pressure in the Patriots’ footballs was deliberate. If you are curious about the answer given by the investigators, here is the full report.
With only 15 balls and fixed group sizes of 11 and four, there are 1,365 different label assignments. You can enumerate them all rather than simulate: for each set of four Colts labels, the other 11 are Patriots. There are four assignments with a statistic at least as large as observed, giving an exact one-sided p-value of 4 / 1365, approximately 0.00293. The simulation above should give a nearby estimate; it need not reproduce that value exactly.
The following optional calculation verifies the exact comparison using the same assumed pressure drops. The small tolerance includes assignments mathematically equal to the observation despite floating-point arithmetic.
from itertools import combinations
values = football_combined['Pressure Drop'].to_numpy()
exact_differences = []
for colts_positions in combinations(range(len(values)), 4):
    colts_sum = values[list(colts_positions)].sum()
    patriots_mean = (values.sum() - colts_sum) / 11
    exact_differences.append(patriots_mean - colts_sum / 4)
exact_differences = np.array(exact_differences)
extreme = np.count_nonzero(exact_differences >= observed_difference - 1e-12)
print('Label assignments:', len(exact_differences))
print('At least as extreme:', extreme)
print('Exact p-value:', round(extreme / len(exact_differences), 5))
Label assignments: 1365
At least as extreme: 4
Exact p-value: 0.00293
10.2.6. Section Practice#
Use this short exercise to check the main workflow from this section.
### Exercise: Practice Comparing Two Groups
# A warehouse weighs packages from two suppliers. Each value is the drop in weight
# (grams) from the label weight.
#   1. Use groupby to compute the mean drop for each supplier.
#   2. Compute the test statistic: mean drop of supplier B minus supplier A.
#   3. Print the two means and the difference, rounded to 2 decimals.
import pandas as pd

packages = pd.DataFrame({
    'supplier': ['A'] * 6 + ['B'] * 5,
    'drop': [1.2, 0.8, 1.5, 1.0, 0.9, 1.3, 2.1, 1.9, 2.4, 1.7, 2.2],
})
### Your code starts here


### Your code ends here
Supplier A: 1.12
Supplier B: 2.06
Difference (B - A): 0.94